The top 5 most important google analytics reports
Okay maybe I lied. It is nearly impossible to assume that all Analytics users are going to need the same reports.
Or find certain reports more valuable then others.
I mean an e-commerce site has a very different way of using their website then a blog about yoga.
Nonetheless, these are the top 5 most important Google Analytics reports for most websites.
These analytics reports give much more information about your website’s health…when interpreted correctly.
Let’s get started.
Here is what you need to read this blog post
- An Analytics account
- Data from a couple months
- A clear understanding of how users navigate your site
- The ability to edit your site
The top 5 most important Google Analytics reports are
Google Analytics Report #1 Channels
The channels report is important for websites because it shows where users are coming from to get to the site. If a site is heavily focused on SEO they would hope to see their organic number growing week after week.
If a company focused on social media, they should monitor this report and see which social media site is the most effective.
Once you get a clear idea of how users are landing on your site you can start optimizing for that type of traffic.
If a twitter offer works better then an email campaign, maybe shift your focus to how to get more twitter users. It really depends on what action you are trying to get users to take once they visit your site.
To get to the channel report in Google Analytics go to Acquisition > All Traffic > Channels.
Here is an example report.
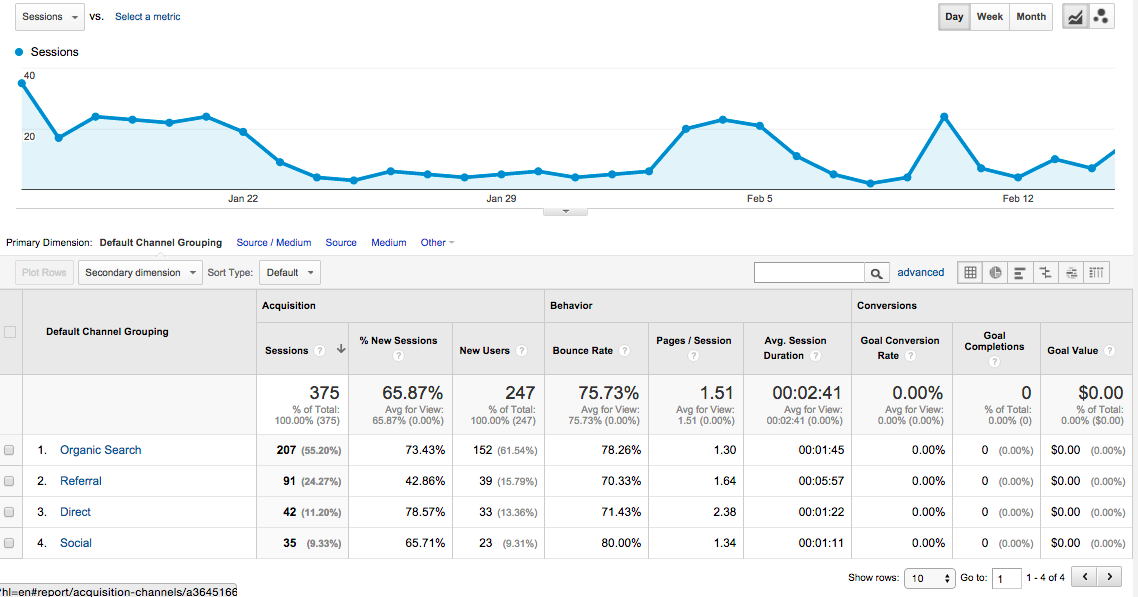
It looks like organic search is working best for this site and referral traffic is a close second.
You should drill down into each of these channels to understand where exactly the source is coming from. I have blogged about the referral spam entering most people’s Analytics account. So these numbers are slightly skewed.
Most sites will find that organic search is a big source of traffic for them. If you click the channel to drill down you will likely see a not provided result.
Read the second report to learn how to steal some of this data back.
Google Analytics Report #2 Search Engine Optimization
The second most important Google Analytics report is going to show 3 different metrics.
To get to this report go to Acquisition > Search Engine Optimization
You will see 3 reports, queries, landing pages, and geographical.
In order to see the data you must connect your Google Webmaster’s Tools account. Simply click the button and follow the wizard.
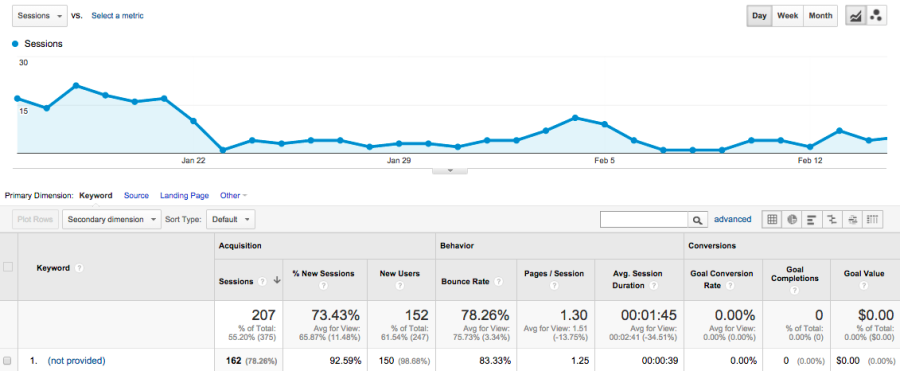
Once you get this report you will be able to see the top 10 search keywords, their clicks and CTR on your site.
This is important when optimizing for future keywords. If a keyword is getting a lot of traffic, you can try a closely related keyword and see if you can replicate the results.
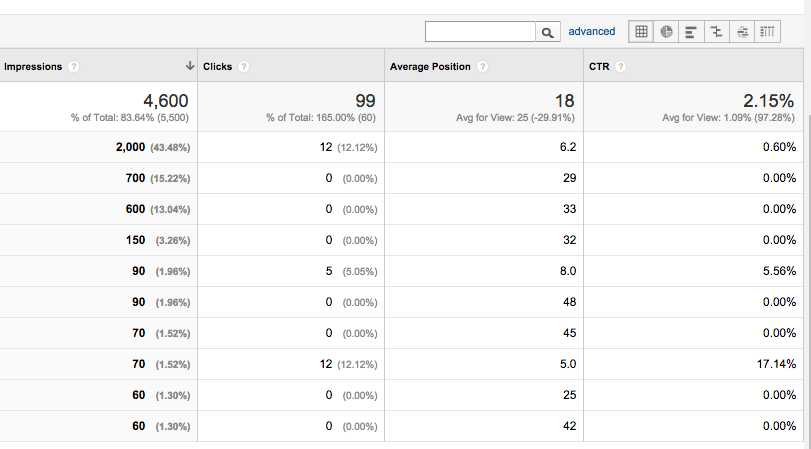
I hid my keywords but here is the results of the top 10 keywords on this site.
If you run this report on your site you can find which of your keywords is getting clicked on the most and where it is ranking. This is big time for a small business who is not sure what to do next to get more traffic and convert more leads.
The next important report you can see here is your landing pages which will show what pages a user is coming to when they are finding your website.
If your keywords are ambiguous this will help.
If you keyword optimized a page for 1 or 2 keyword variations, then the landing page should give you a good idea of what a user is looking for when they land on your site.
Lastly, if you find the geographical report under search engine optimization it will show where the traffic is coming from. This might be more valuable to a brick and mortar business but it can still show you where a lot of your users are based.
This is important for local search and long tail city specific keyword phrases.
For example, say you sell raincoats in Seattle but most of your users come from Bellevue.
Then you can make a page on your site optimized for selling coats to people in Bellevue to see if you can get more traffic from search.
Google Analytics Report #3 Events
Events are any action taken on your website. It can be a form submit, watching a video, or clicking a link (amongst others). If you are not familiar with websites and code it could be a little tricky to get one up and running on your website.
Luckily Google makes it pretty easy.
Here is the developer link to make the piece of code needed to create an event.
If that is not helpful you can try this website to generate the code.
Or try and install a plugin on your WordPress site.
An event is a great report to monitor because it gives you actionable data on what users are doing on your site.
If you’re website’s goal is to have someone sign up for your weekly email newsletter, then tracking an event can tell you how effective the placement, copy, and user experience are for the form.
It makes split testing much more effective if you have a way to find how many people convert based on an event.
The more data the better.
Google Analytics Report #4 Goals
A Goal is similar to an event but it can be a little more in depth. A goal is anytime a user satisfies a rule on your website. It could they hit the home page, sign up for a demo, and then successfully make it to the thank you page.
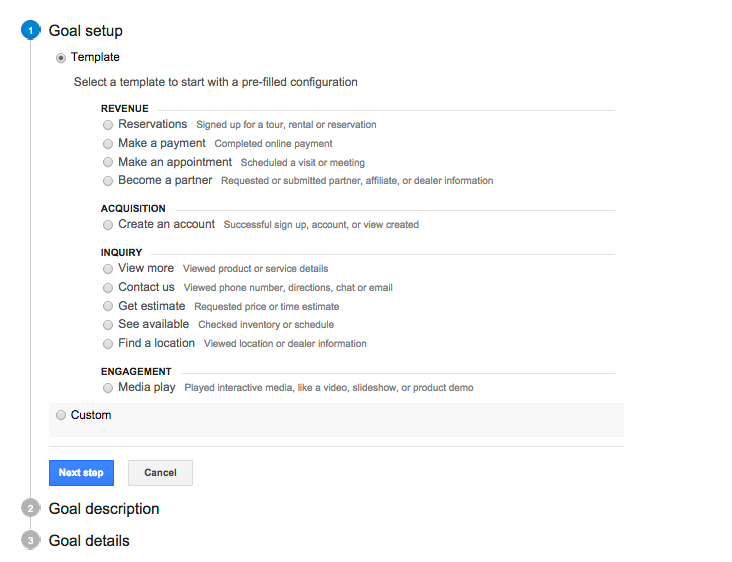
To set up a goal go to admin > goals > and create a goal.
There are predefined goals like visiting a page URL (which supports wildcards) or you can get more technical with a regular expression.
Google Analytics Report #5 Behavior Flow
This last report is a great for websites that must educate a user before they complete an action. Some websites are simple and when you hit the home page it is immediately clear what the goal of the site is.
For example: Instagram wants you to sign up and start using their social media site.
But a website that needs to build credibility, show competency, and show pricing needs to create a few pages to achieve this.
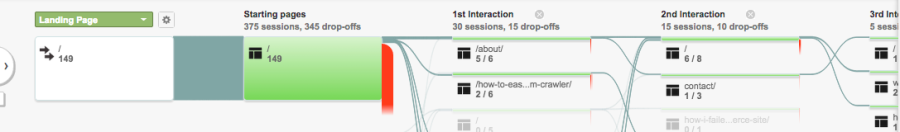
The Behavior Flow report will show you how users move through your site. This is important to see where users are leaving or not getting to the page that has the conversion on it.
If you find that someone goes to your home page, then your portfolio, and then leaves…your site might need to take a look at the work displayed on the portfolio.
Maybe a user gets all the way to the sign up page and leaves? Consider simplifying the sign up process or building more credibility right at the end of the process.
Here is what a behavior flow report looks like.
And there you have it. The top 5 most important google analytics reports. If you need help getting Google Analytics set up on your site or finding these reports, leave a comment on here and I will help you out.
Join The Newsletter
Get occasional emails from me when I publish new projects and articles.